What is Prometheus?
Prometheus is a system that collects data on the performance of servers, applications or services. It regularly queries information such as CPU utilization, response times or memory consumption and stores it in a special database. This allows trends to be identified and problems to be analyzed quickly.
Advantages of Prometheus:
- Collect data: automatically collects data from various sources.
- Recognize problems: By saving the data, historical trends can be analyzed.
- Alerts: Prometheus can be configured to automatically alert on problems, such as high server load, longer response times or high disk usage.
What is Grafana?
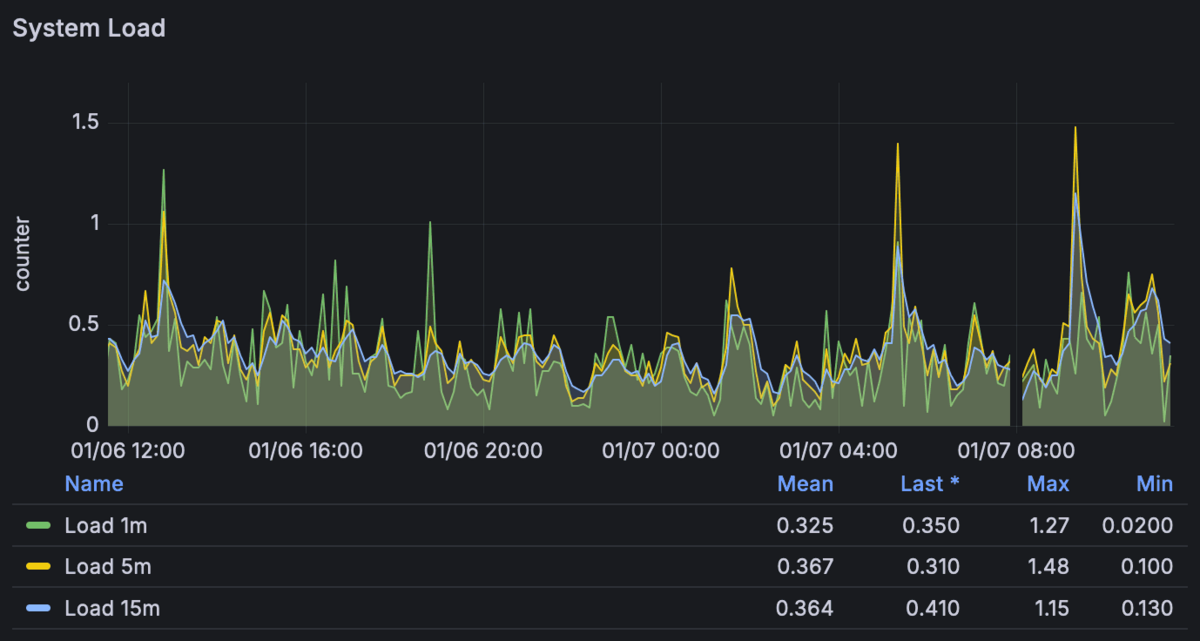
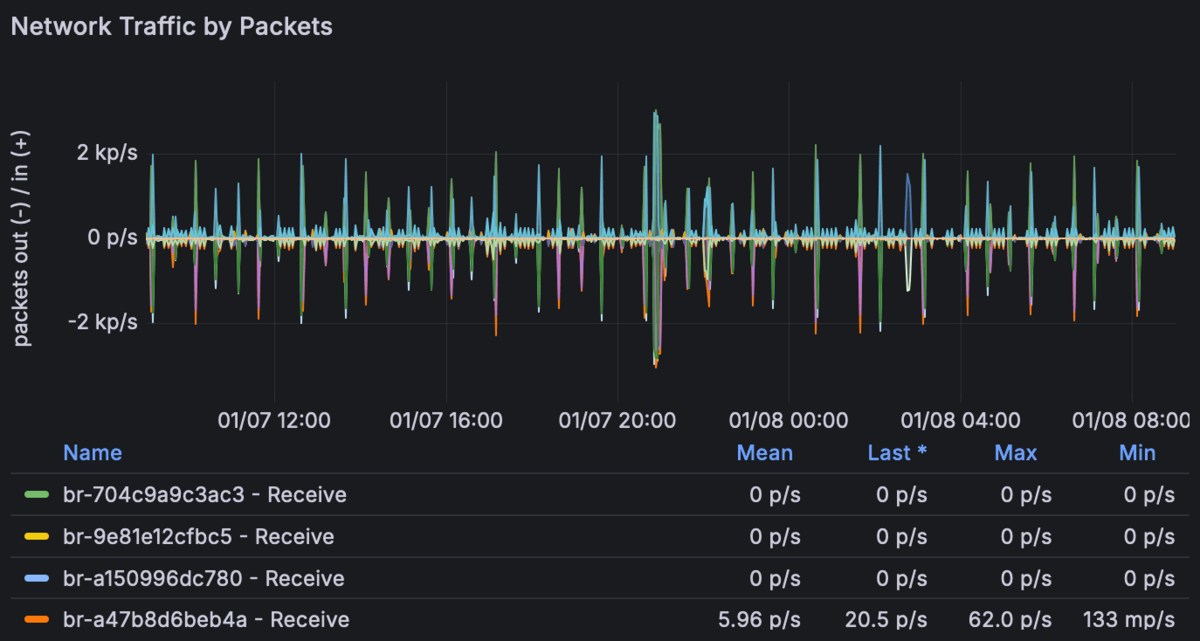
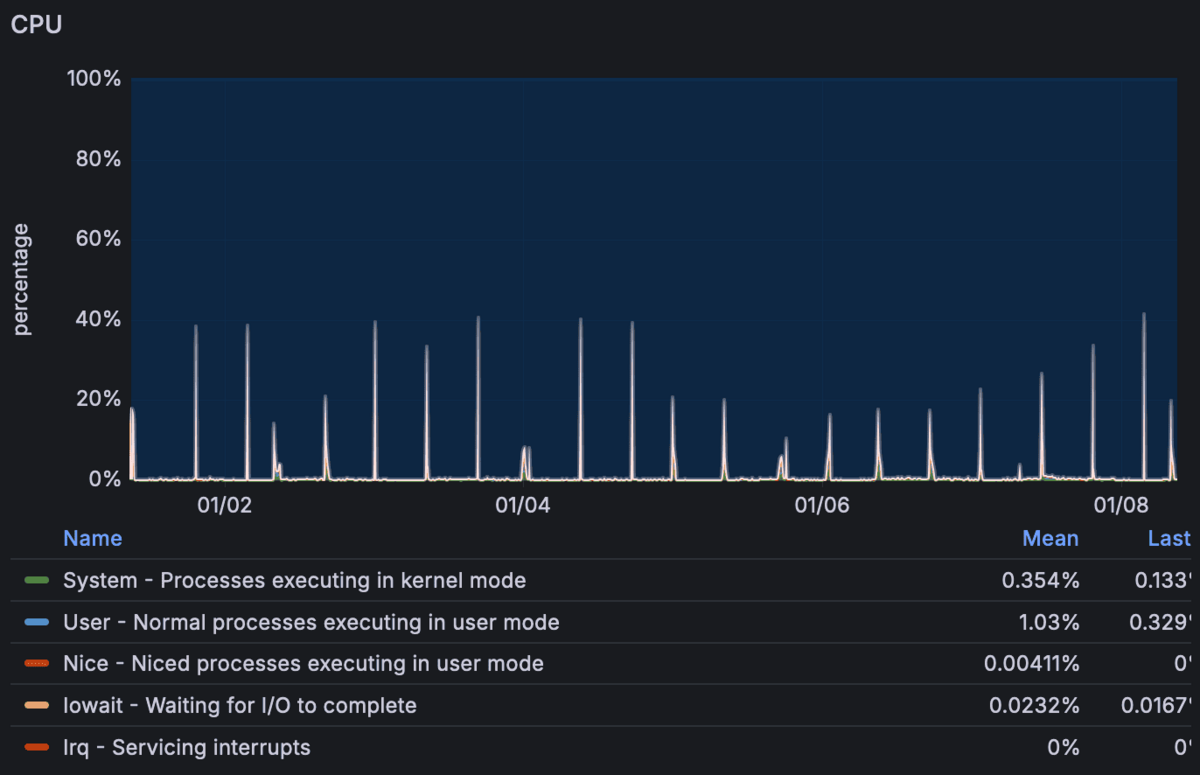
Grafana is a visualization tool that displays the data collected by Prometheus in a vivid way. Grafana can be used to create dashboards that clearly display all important key figures.
Advantages of Grafana:
- Appealing visualization: data is presented in easy-to-understand and clear charts or tables
- Individual dashboards: Dashboards can be adapted to your own needs or the specific requirements of customers.
- Easy to use: Even without in-depth technical knowledge, dashboards can be used to gain insights into the performance of systems.
Why use Prometheus and Grafana together?
Prometheus collects and processes the data, while Grafana prepares this data and displays it in an easy-to-understand way. Together they help to monitor the performance of systems and detect problems at an early stage.
We use these tools to constantly evaluate the utilization of our customer servers and identify potential bottlenecks at an early stage, which we can then react to promptly.
Based on the historical data, we can identify trends in server utilization at an early stage and react accordingly.
What is the Alertmanager?
The Alertmanager is a supplementary tool to Prometheus that ensures that alerts (alarms) are organized and forwarded to the right people or systems. Examples:
- If the load on a hard disk exceeds a defined threshold value, an alarm is triggered.
- If the utilization (load) of a server is too high over a longer period of time
- If the system cannot be reached
Advantages of the alert manager:
- Notifications: Alerts can be sent via email, Slack, SMS or other channels.
- Prioritization: Important alerts can be highlighted, while less urgent alerts are collected.
- Grouping: Similar alerts are grouped together to increase clarity.
- Flexibility: The alert manager can be configured to notify different teams or individuals depending on the nature of the issue.
With the alert manager, we can ensure that we are informed immediately if there are critical problems.
Conclusion
Prometheus and Grafana are essential tools for us to monitor the performance and stability of the systems we manage. Supplemented by the Alert Manager, they provide a comprehensive system that not only allows us to monitor but also to manage alerts. They help us to identify problems before they become serious and provide valuable insights into system performance. For us, they mean clear added value: transparent monitoring, optimized performance and greater reliability for our customer projects.


